> ## Documentation Index
> Fetch the complete documentation index at: https://docs.contextual.ai/llms.txt
> Use this file to discover all available pages before exploring further.
# ATE Board Validation Agent
> AI agent for automated root cause analysis of ATE board validation failure logs
## Overview
This agent performs automated root cause analysis on ATE (Automated Test Equipment) board validation failure logs. It cross-references multi-site test logs against a debug reference guide to decode error codes, trace fault propagation across test phases, and identify whether failures are board defects or tester artifacts—work that would otherwise require a hardware validation engineer to manually correlate hundreds of timestamped events across power, memory, PCIe, and signal integrity subsystems.
**Powered by the [Device Log Analysis](/how-to-guides/agent-composer-templates#device-log-analysis-enterprise) template** in [Agent Composer](/quickstarts/agent-composer)—available for Enterprise customers; [request a demo](https://contextual.ai/request-a-demo) for access.
## Try the Demo
Analyze board validation logs yourself
ATE samples preloaded—pick a suggested query and run the analysis.
Running on the production DLA template. Demo queries are cached and sped up for demonstration purposes.
## The Problem
When a board validation session fails, engineers must determine whether the fault lies with the device under test (DUT), the tester hardware, or a transient environmental condition. ATE logs contain:
* Per-site parallel test events across multiple DUT sockets
* Power rail telemetry (VDDQ, VCCIN, VCCIO, VPP, VCCSA) sampled throughout each test phase
* DDR5 training sequences with per-phase margin measurements
* PCIe link training LTSSM states and equalization results
* Signal integrity eye measurements, insertion loss, jitter, and skew
* Voltage regulator diagnostics including temperature, efficiency, and ripple
* Tester HAL artifacts (e.g. multi-site inrush coupling transients) that must be distinguished from real faults
Without tooling, a failure like "SITE:2 DDR5 training fail" requires manually correlating voltage telemetry, thermal readings, retry logs, and VR diagnostics across hundreds of lines to determine the actual root cause.
## How It Works
### In production
**What you do:** Upload an **ATE failure log** and optionally a **debug reference guide**, then ask a query—for example *"Why did SITE:2 fail?"*.
**What happens automatically:** A multi-agent implementation takes over. The system parses the log, builds a searchable database from the log and reference files, runs root cause analysis across all test phases and sites, and produces outputs.
**Pipeline stages:** Uploading files → parsing logs → building the database → root cause analysis → generating the report.
**Outputs:** The agent delivers a **detailed RCA report** covering executive summary, per-site timeline, decoded errors, voltage/thermal trajectory, and prioritized recommended actions. It can also generate **visualizations** such as VDDQ voltage sag charts and multi-site comparison tables.
**Auditable:** Every step is visible—tasks, trajectory, intermediate artifacts, and the final report—so validation teams can review the analysis and act on findings.
### In this demo
Sample ATE files are **preloaded**; choose a suggested query and run the analysis.
## Example Questions
Suggested queries in the demo:
* "Why did SITE:2 fail?"
* "When did this problem first appear?"
* "Is this a device failure or a tester failure?"
## Output
Example outputs from the three suggested queries:
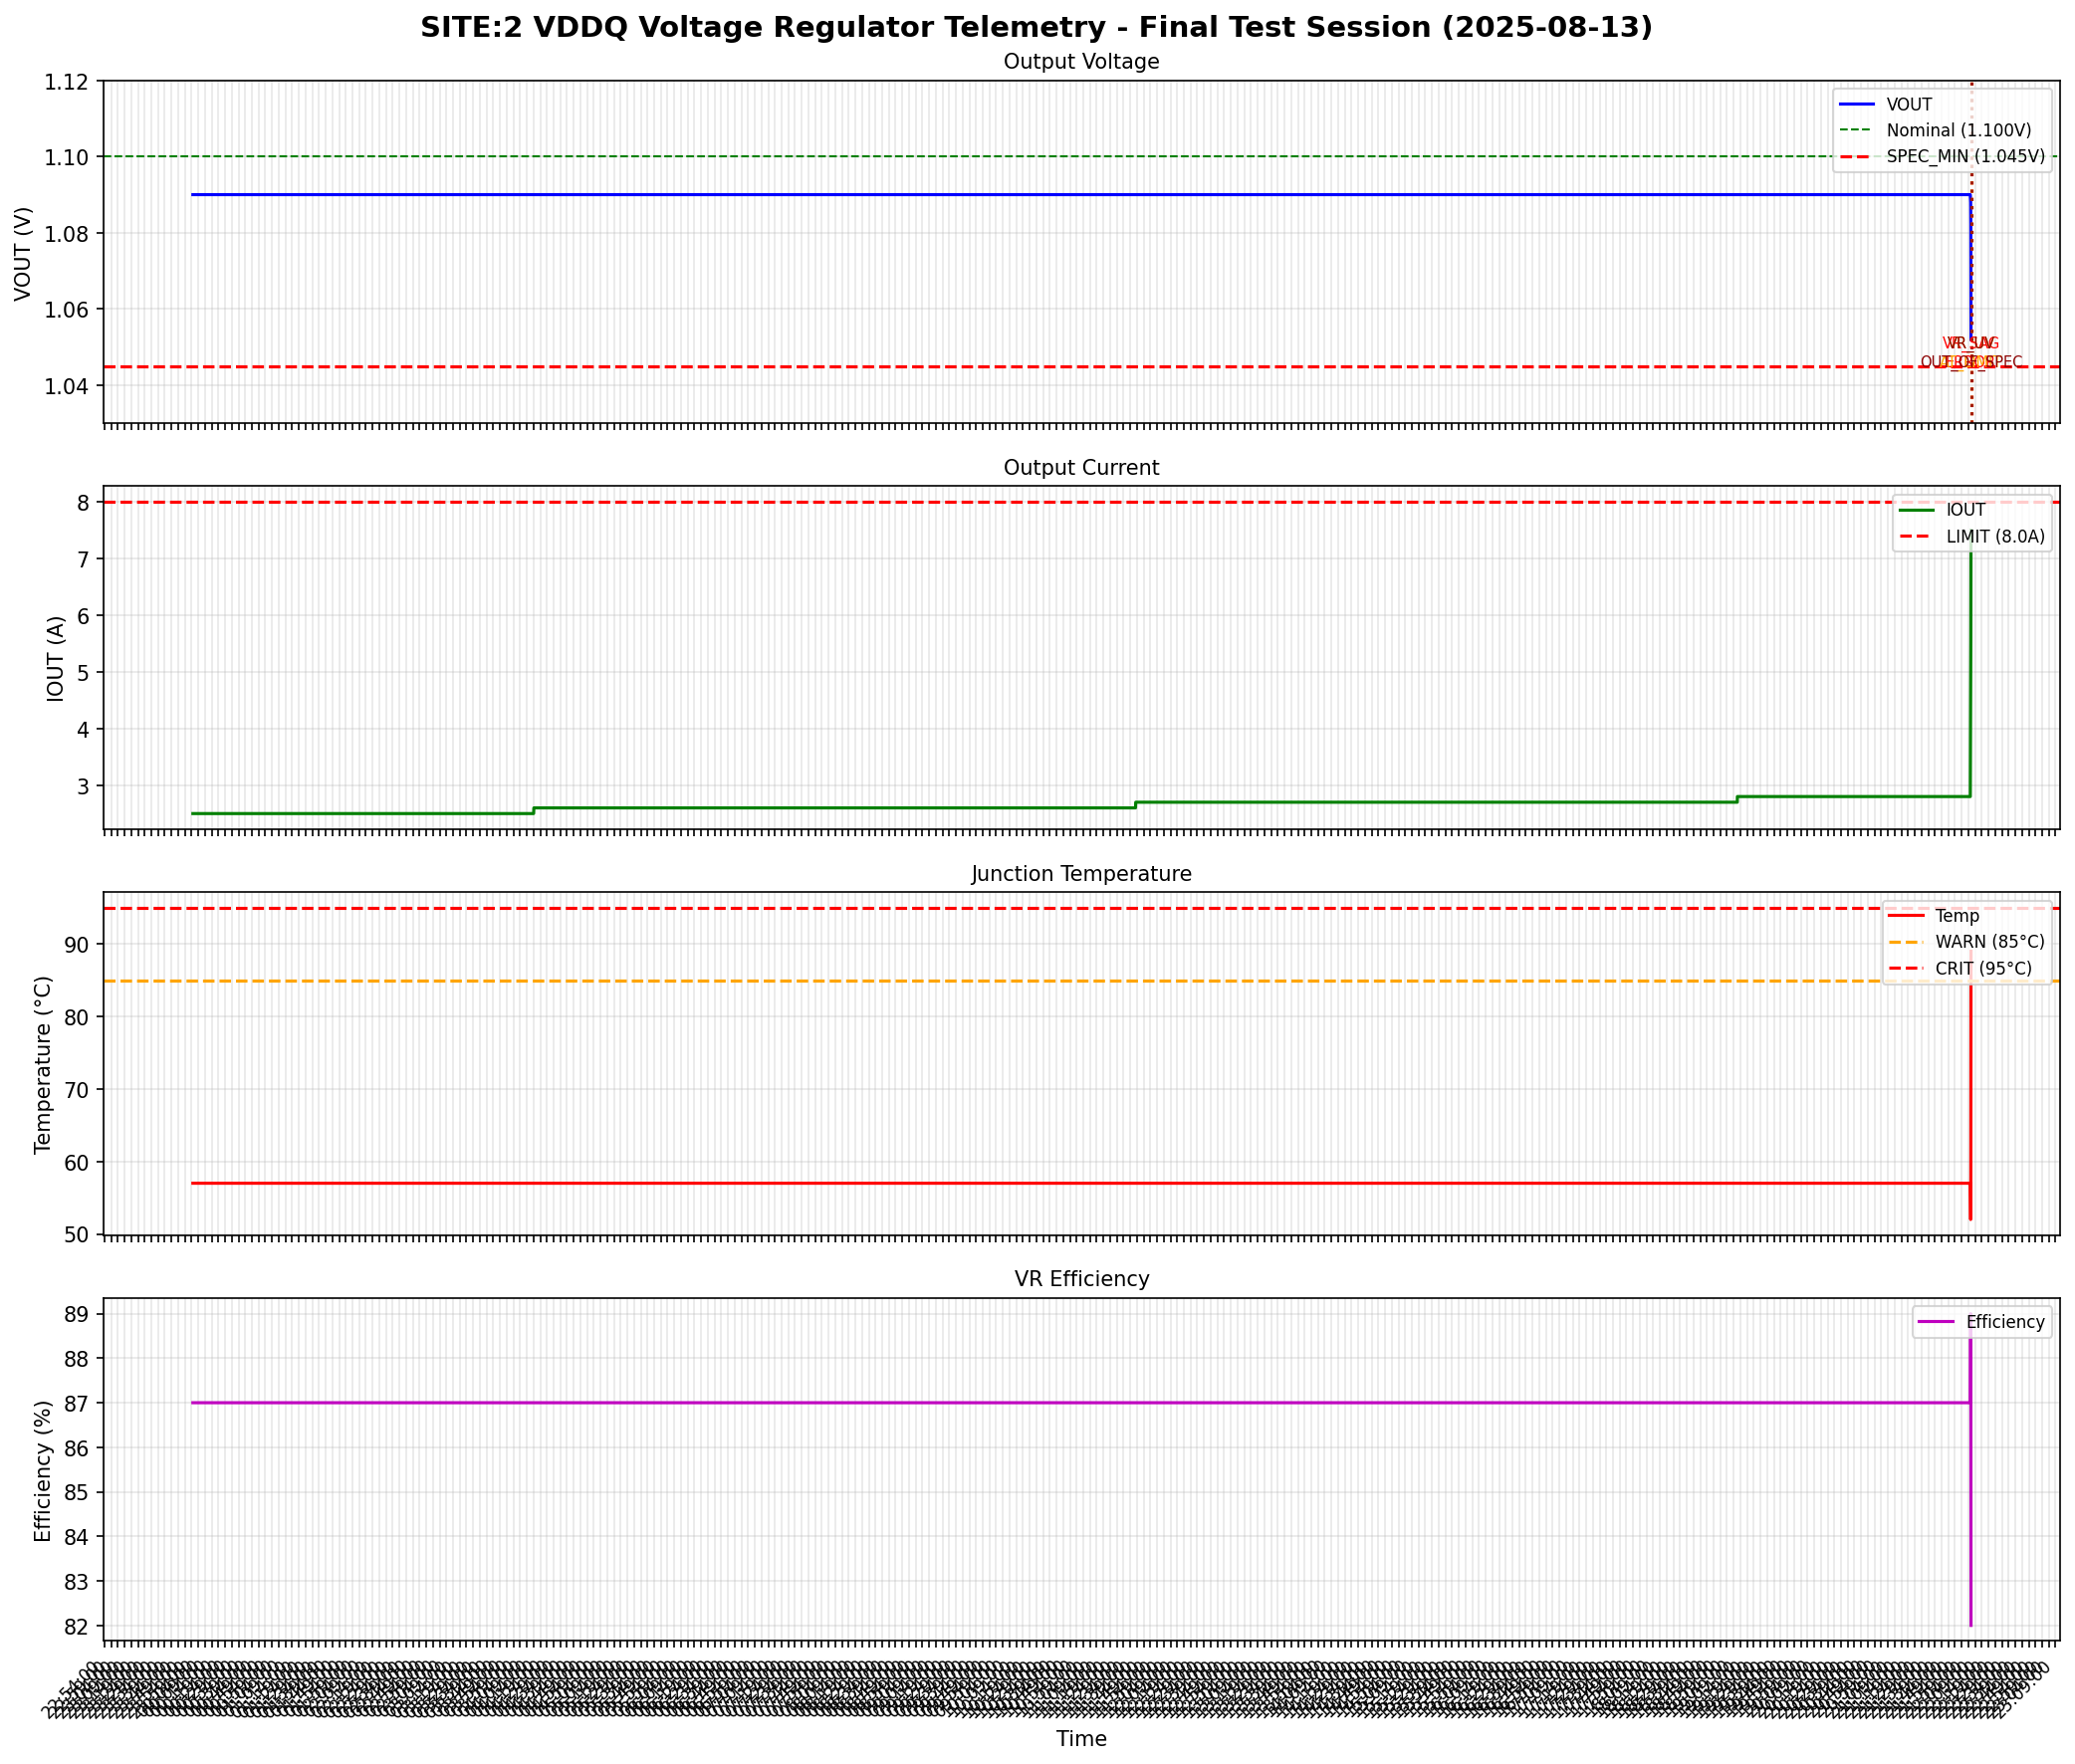
**"Why did SITE:2 fail?"** — VDDQ voltage regulator telemetry for the final test session: output voltage sagging to the spec minimum, output current climbing toward the limit, junction temperature spiking above the warning threshold, and efficiency degrading — all four panels confirm a single failing component:
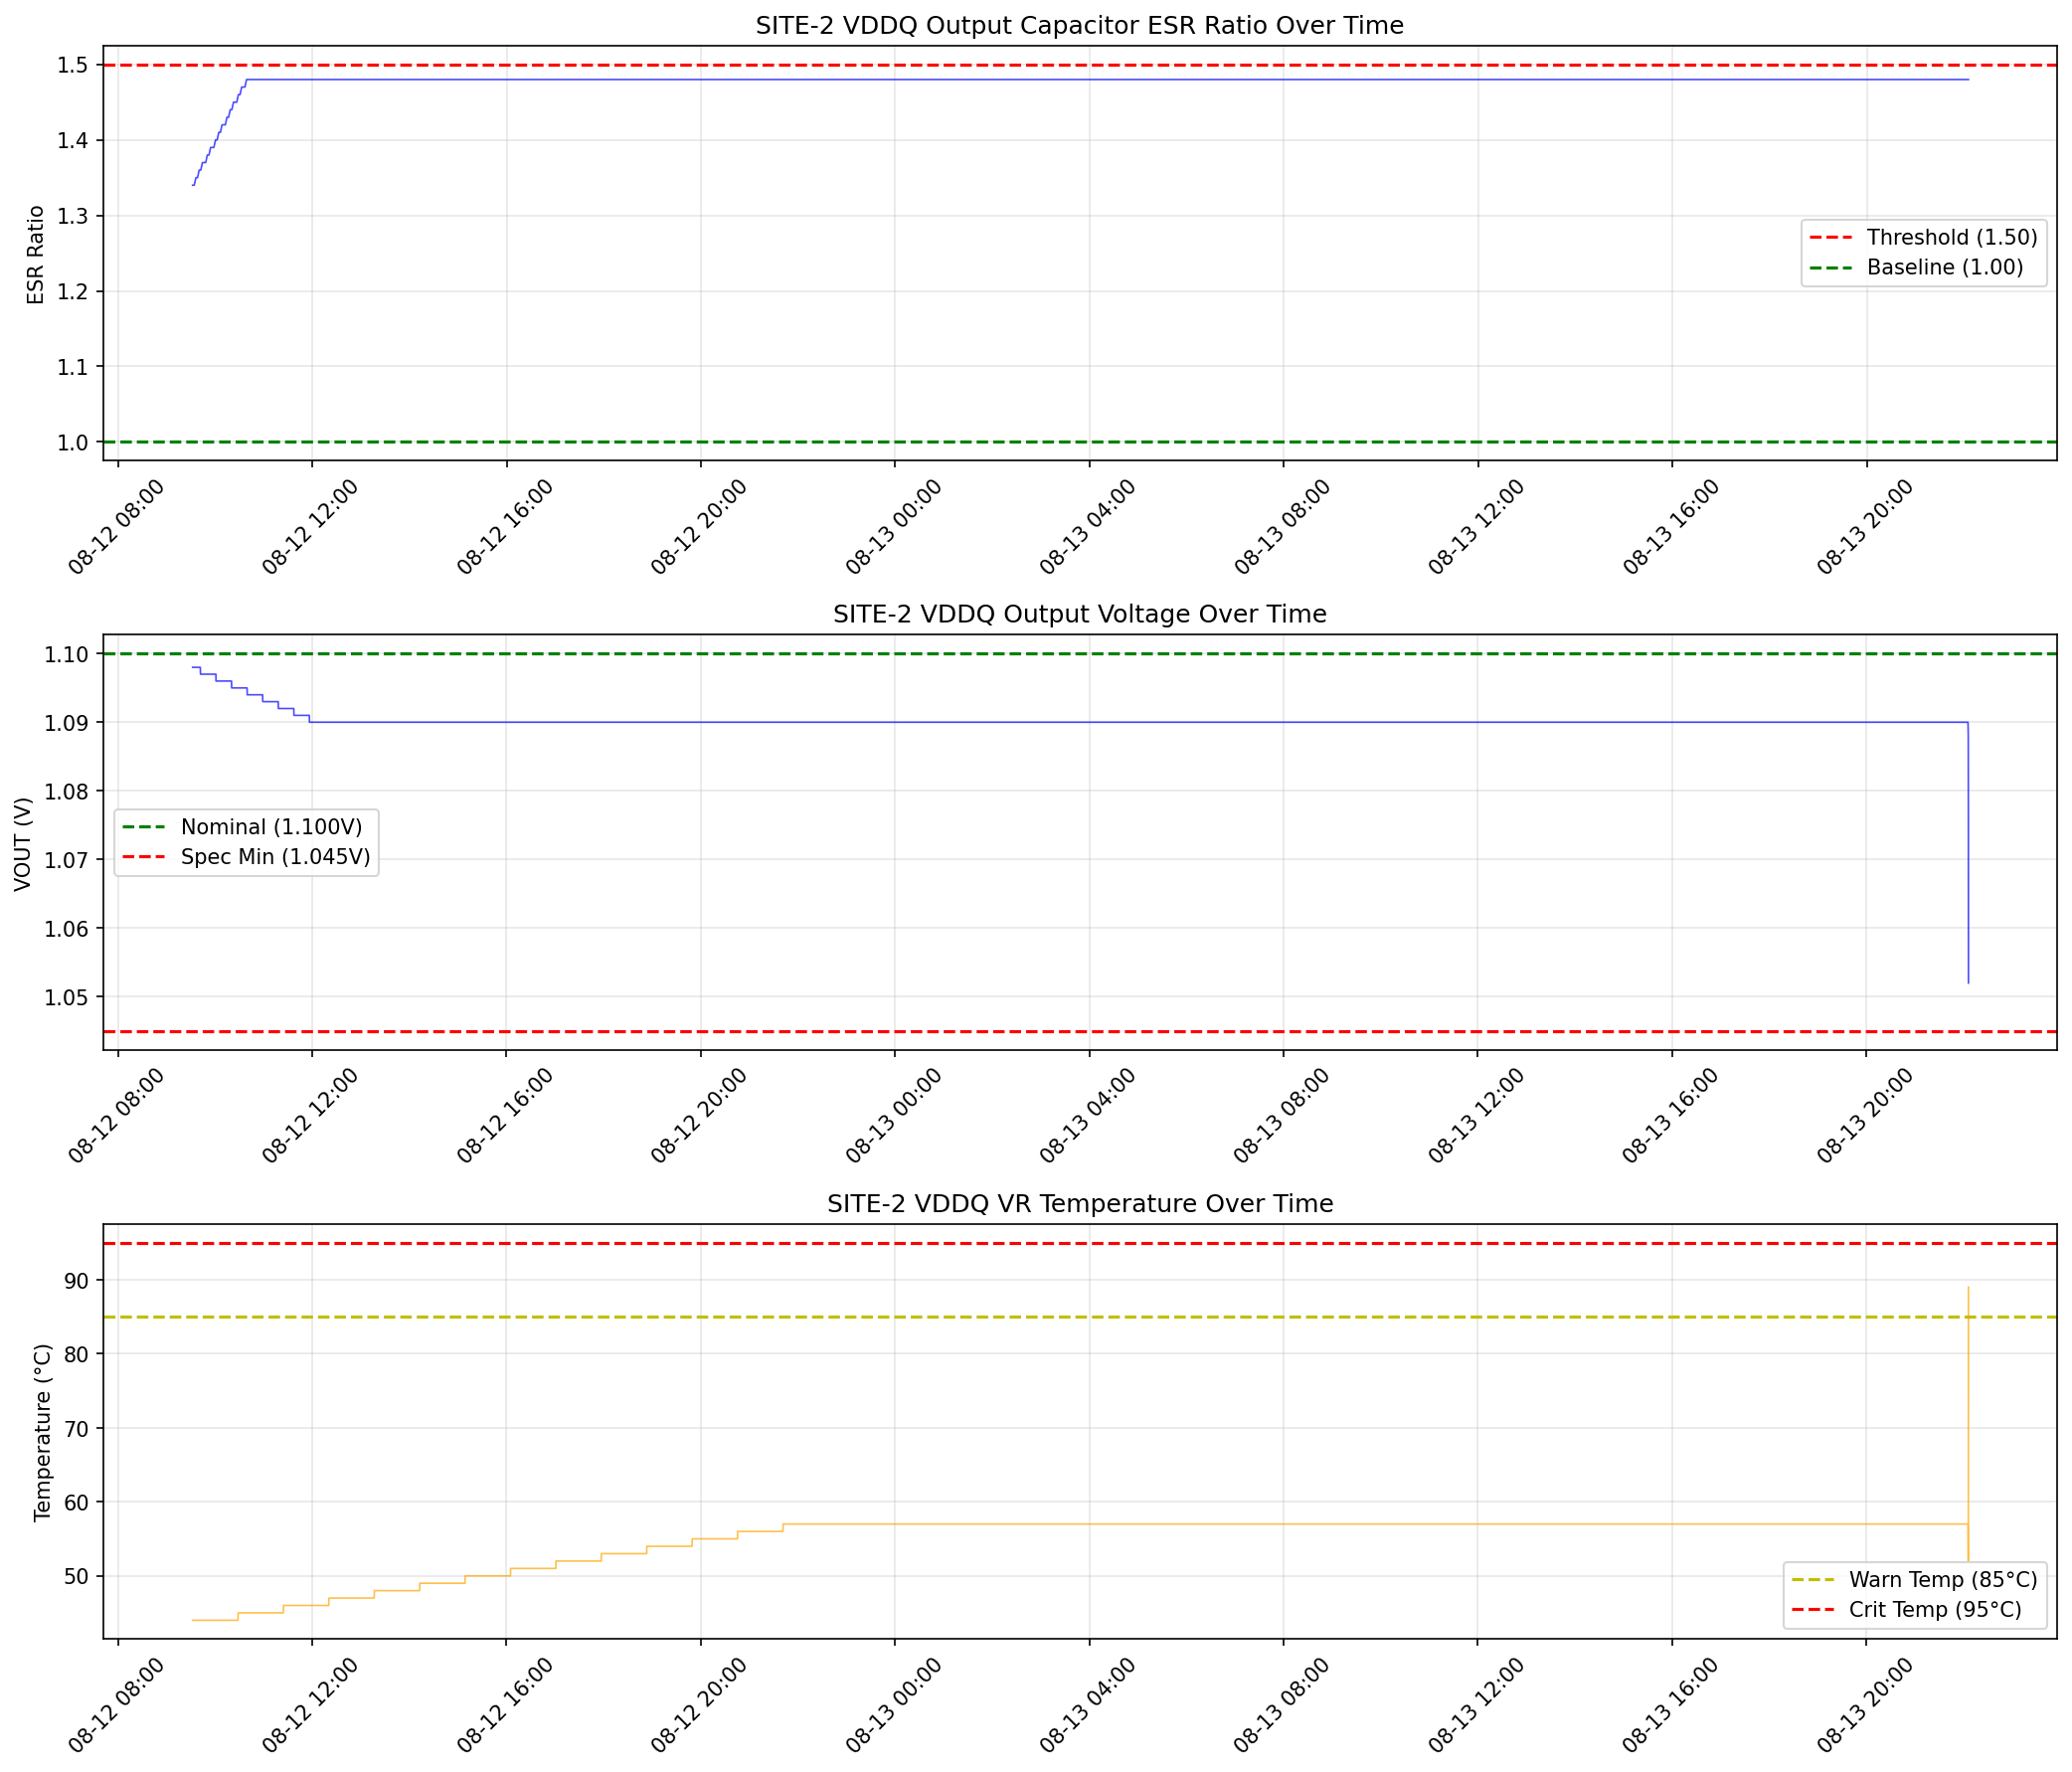
 **"When did this problem first appear?"** — Long-horizon view showing the VDDQ output capacitor ESR ratio climbing over time, with voltage holding nominal until the final test session where it drops to the spec minimum as temperature rises:
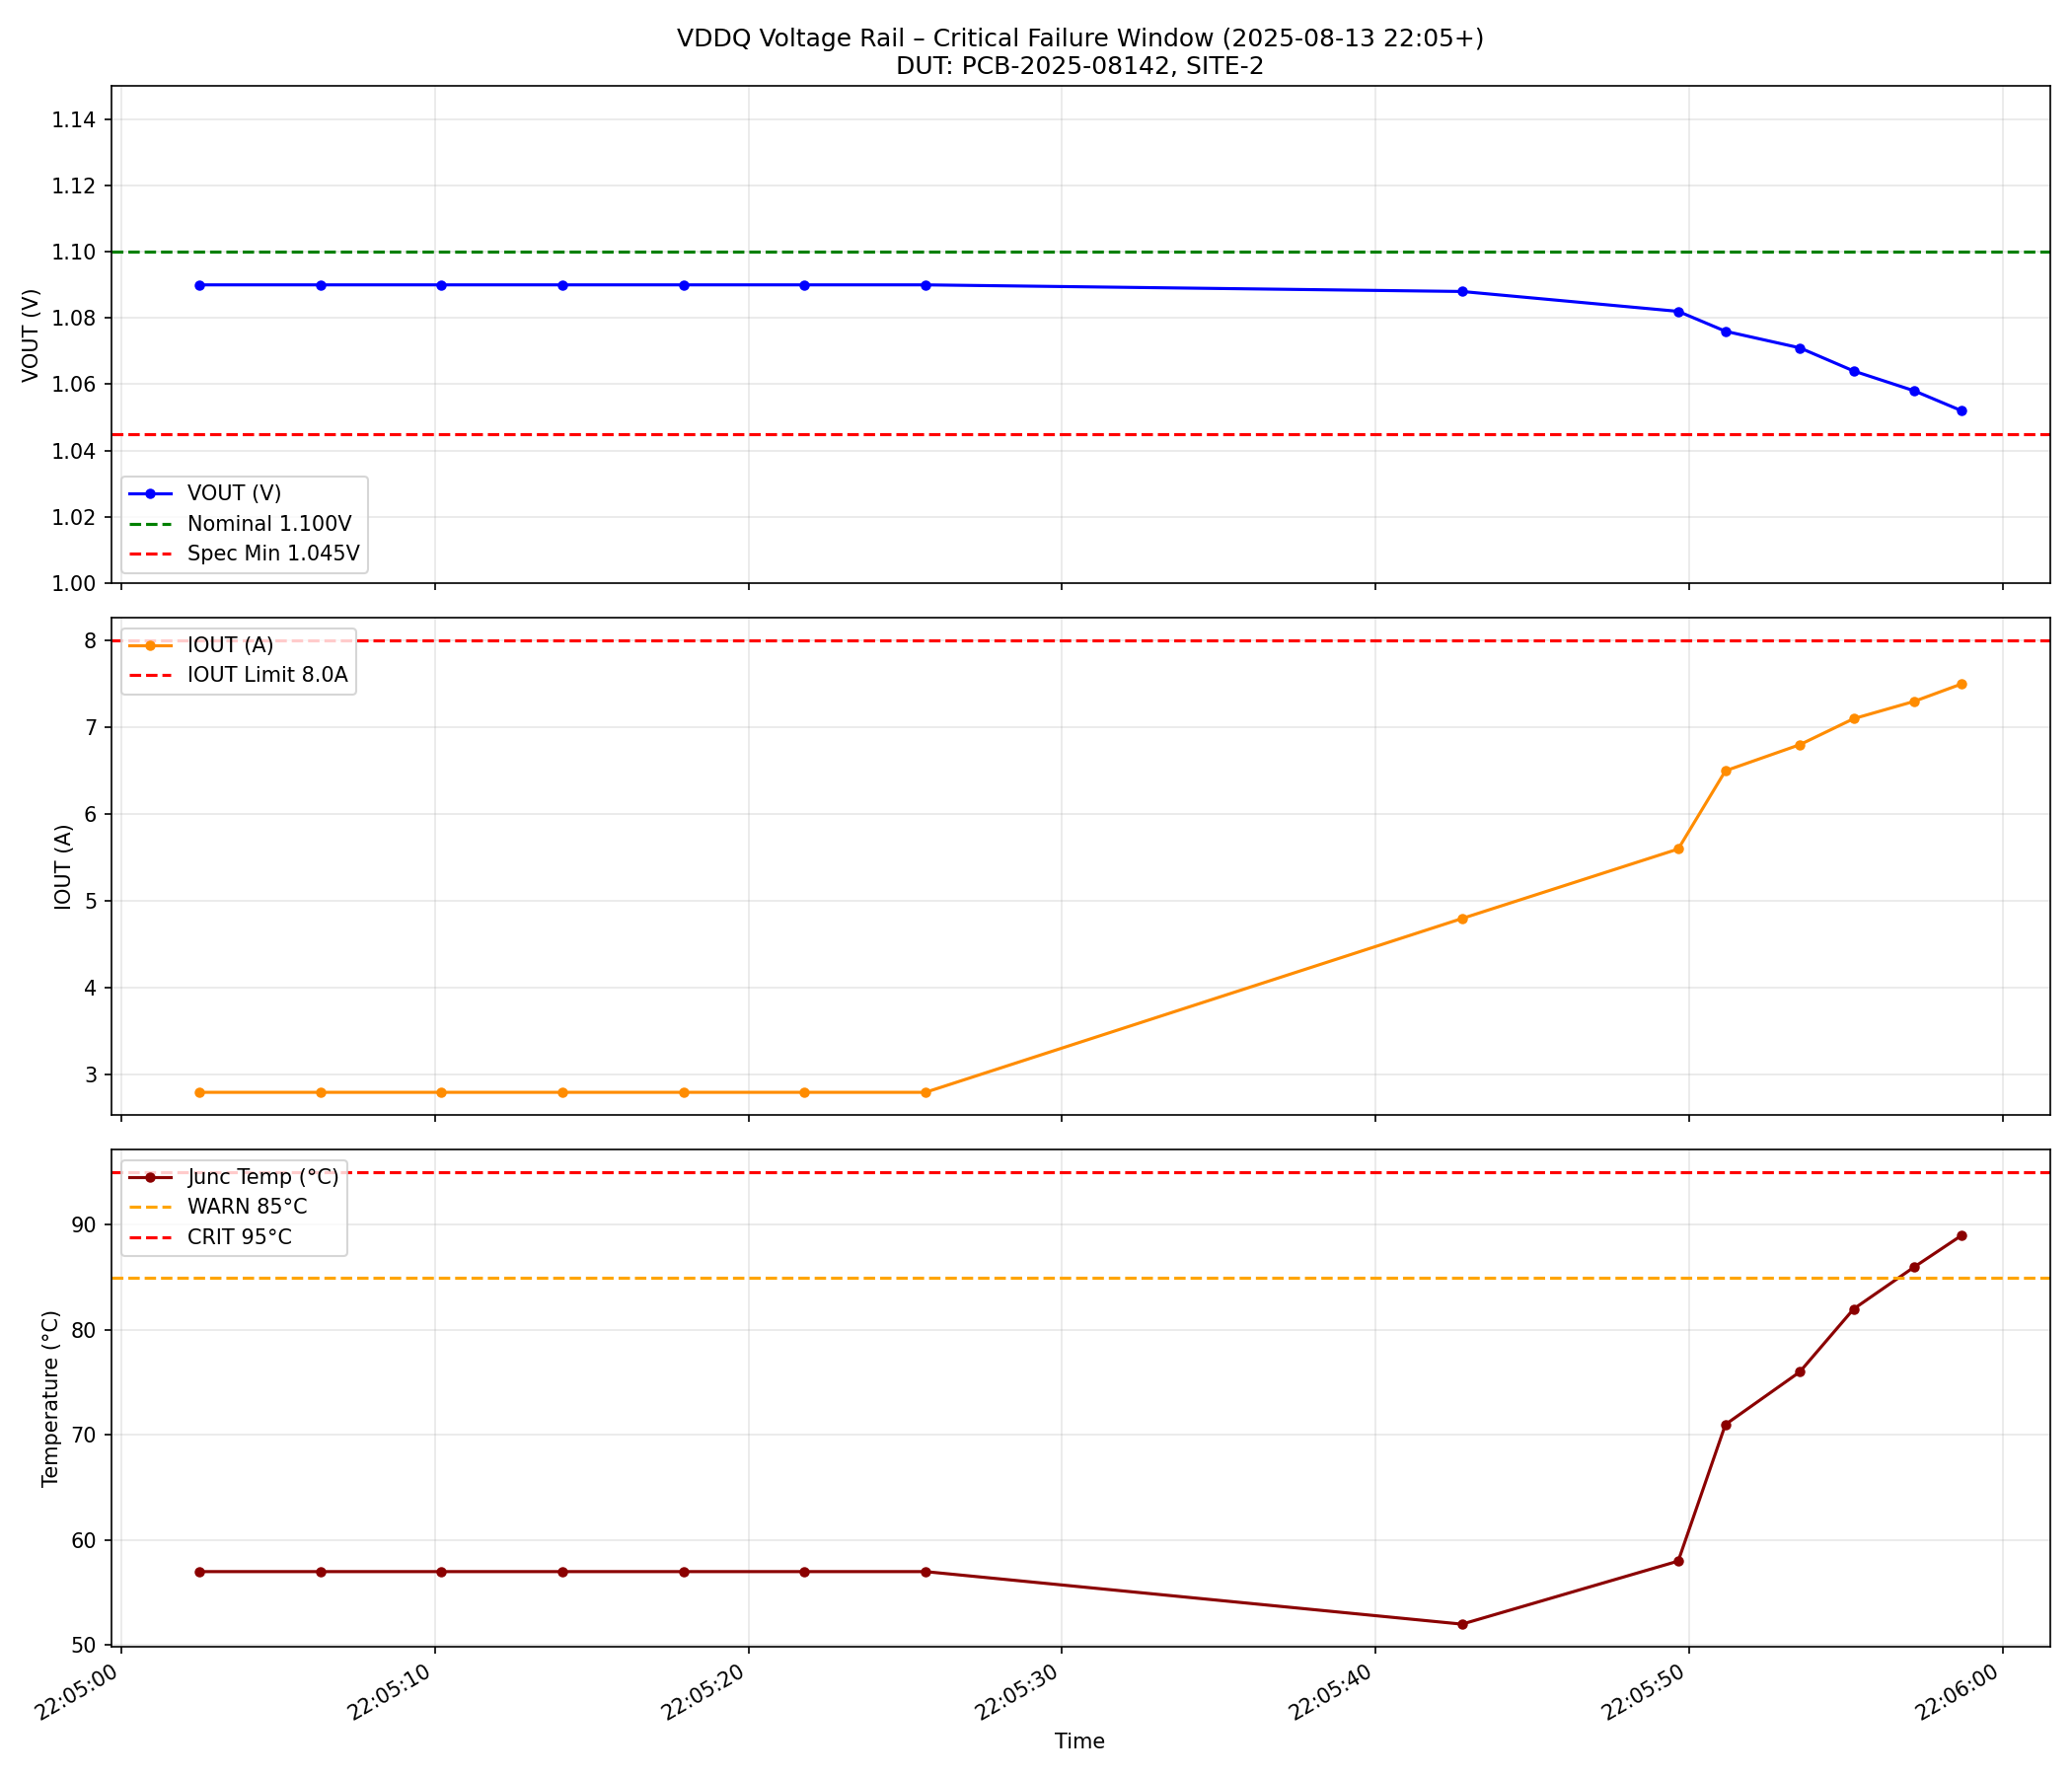
 **"Is this a device failure or a tester failure?"** — Zoomed into the critical failure window, VOUT drops from 1.089V to just above the 1.045V spec minimum, IOUT climbs to 7.5A, and junction temperature crosses the 85°C warning threshold — all on a single DUT while other sites remain nominal, confirming a board defect:
 The **final RCA report** includes:
* **Executive summary** — Which site(s) failed, root cause (e.g. VDDQ voltage regulator degradation), and yield impact
* **Fault timeline** — Chronological sequence showing voltage sag progression, training retry escalation, and cascade into secondary failures
* **Per-site comparison** — Side-by-side pass/fail status and key metrics (VDDQ voltage, VR temperature, DDR5 eye width) across all 4 test sites
* **Root cause chain** — Causal trace from the originating hardware fault through each downstream failure (e.g. VDDQ sag → DDR5 training fail → PCIe Gen fallback → bin FAIL)
* **Tester artifact analysis** — Identifies HAL transient events (e.g. `HAL_VDDQ_COUPLE_0x0B`) and correctly classifies them as non-causal measurement artifacts rather than real faults
* **Recommended actions** — Prioritized table with action and rationale (e.g. replace VDDQ output capacitor on failed DUT, retest on same tester to confirm tester health)
## ATE sample files in the demo
* **Device log** (`ate_device_log_30mb.txt`) — A timestamped multi-site board validation log with entries from subsystems including ATE-SYS, ATE-HAL, ATE-PWR, ATE-FPGA, DUT-VR, DUT-THERM, and per-site test events (SITE-1 through SITE-4). Each line includes severity (INFO/WARN/ERROR), subsystem tags, and synthetic diagnostic codes.
* **Debug reference guide** (`ate_debug_rules.txt`) — An ATE board validation debug reference covering power rail specifications, DDR5 training sequence codes, PCIe link training codes, voltage regulator diagnostic codes, signal integrity measurement codes, test bin definitions, HAL artifact classifications, and common root cause patterns.
## Learn More
* [Device Log Analysis (overview)](/examples/device-log-analysis) — General DLA template and all three sample datasets
* [3GPP Wireless](/examples/3gpp-wireless-log-analysis) — LTE-style eNB/device logs
* [Mazda Infotainment](/examples/mazda-infotainment-log-analysis) — Infotainment crash logs
* [Getting Started with the Contextual AI Platform](/quickstarts/getting-started)
* [Agent Composer Templates](/how-to-guides/agent-composer-templates) — Basic Search, Agentic Search, and Device Log Analysis (Enterprise)
* [Request a demo](https://contextual.ai/request-a-demo)
The **final RCA report** includes:
* **Executive summary** — Which site(s) failed, root cause (e.g. VDDQ voltage regulator degradation), and yield impact
* **Fault timeline** — Chronological sequence showing voltage sag progression, training retry escalation, and cascade into secondary failures
* **Per-site comparison** — Side-by-side pass/fail status and key metrics (VDDQ voltage, VR temperature, DDR5 eye width) across all 4 test sites
* **Root cause chain** — Causal trace from the originating hardware fault through each downstream failure (e.g. VDDQ sag → DDR5 training fail → PCIe Gen fallback → bin FAIL)
* **Tester artifact analysis** — Identifies HAL transient events (e.g. `HAL_VDDQ_COUPLE_0x0B`) and correctly classifies them as non-causal measurement artifacts rather than real faults
* **Recommended actions** — Prioritized table with action and rationale (e.g. replace VDDQ output capacitor on failed DUT, retest on same tester to confirm tester health)
## ATE sample files in the demo
* **Device log** (`ate_device_log_30mb.txt`) — A timestamped multi-site board validation log with entries from subsystems including ATE-SYS, ATE-HAL, ATE-PWR, ATE-FPGA, DUT-VR, DUT-THERM, and per-site test events (SITE-1 through SITE-4). Each line includes severity (INFO/WARN/ERROR), subsystem tags, and synthetic diagnostic codes.
* **Debug reference guide** (`ate_debug_rules.txt`) — An ATE board validation debug reference covering power rail specifications, DDR5 training sequence codes, PCIe link training codes, voltage regulator diagnostic codes, signal integrity measurement codes, test bin definitions, HAL artifact classifications, and common root cause patterns.
## Learn More
* [Device Log Analysis (overview)](/examples/device-log-analysis) — General DLA template and all three sample datasets
* [3GPP Wireless](/examples/3gpp-wireless-log-analysis) — LTE-style eNB/device logs
* [Mazda Infotainment](/examples/mazda-infotainment-log-analysis) — Infotainment crash logs
* [Getting Started with the Contextual AI Platform](/quickstarts/getting-started)
* [Agent Composer Templates](/how-to-guides/agent-composer-templates) — Basic Search, Agentic Search, and Device Log Analysis (Enterprise)
* [Request a demo](https://contextual.ai/request-a-demo)